Easy way to find which query is consuming lots of time in mySQL using default options and tools.
First check if the required options are enabled
mysql> SHOW VARIABLES LIKE '%query%';
+------------------------------+------------------------+
| Variable_name                | Value                  |
+------------------------------+------------------------+
| binlog_rows_query_log_events | OFF                    |
| ft_query_expansion_limit     | 20                     |
| have_query_cache             | NO                     |
| long_query_time              | 10.000000              |
| query_alloc_block_size       | 8192                   |
| query_prealloc_size          | 8192                   |
| slow_query_log               | ON                     |
| slow_query_log_file          | SUSHANTH-VAIO-slow.log |
+------------------------------+------------------------+
8 rows in set (0.01 sec)
Row we are checking are slow_query_log & long_query_time
long_query_time— consists of SQL statements that take more than long_query_time seconds to execute and require at leastmin_examined_row_limitrows to be examined
mysql> SHOW VARIABLES LIKE '%min_exam%';
+------------------------+-------+
| Variable_name          | Value |
+------------------------+-------+
| min_examined_row_limit | 0     |
+------------------------+-------+
1 row in set (0.01 sec)
Once everything is set
mySQLWorkBench
- Open mySQLWorkBench
- Click Server Logs
- On the right side, select Slow Log File
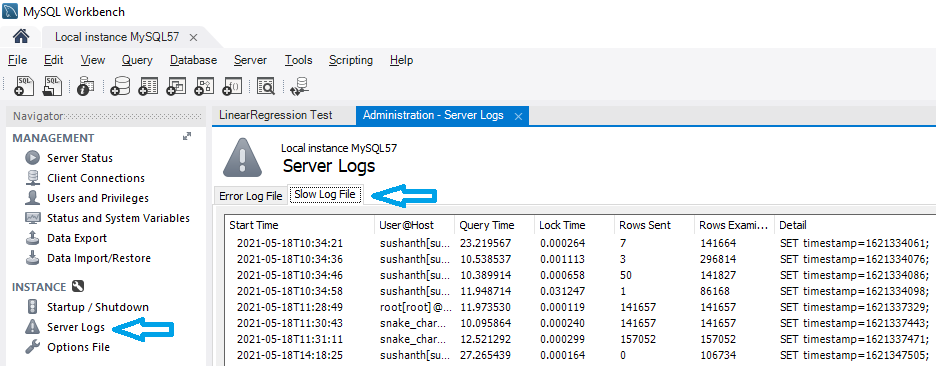
You can right click on the log record and find details and partial query.