General terms
Bull market, Bear market, Face value, Growth and Value Stocks, Dividend, Convertible securities, Debenture, Market Capitalization, Market depth, Compound Annual Growth Rate, Leverage, Share buybacks, Book value, Accounts Receivable, Accounts Payable, Pledging of shares, Diversification, Working Capital, Yield/Dividend Yield, Buffett Indicator, Cash flow, Depreciation, Preferential shares, Banking on Provisions, 10 Red flags, Undervalued / Under Priced
Liquidity Ratios
Current ratio, Quick Ratio, Days Sales Outstanding (DSO)
Leverage Ratios
Debt Ratio, Debt-to-equity (D/E) Ratio, Interest Coverage Ratio (ICR), Debt-to-Total Assets Ratio
Efficiency Ratios
Asset turnover ratio(ATR), Inventory turnover ratio, Days Sales in Inventory (DSI)
Profitability Ratios
Gross margin ratio, Operating margin ratio, Return on equity ratio, Return on Assets (ROA)
Valuation Ratios
Earnings per share (EPS) Ratio, Price-to-Earnings (P/E) Ratio, Price/Earnings to Growth (PEG) Ratio, Price-to-Sales(P/S) Ratio, EV/EBIT Ratio
Financial Ratios
Return on Capital Employed(RoCE), Return on Invested Capital, Cash Profit Margin
Banking Ratios
Net Interest Margin (NIM), Non-Performing Assets (NPA), Provisioning, Capital Adequacy Ratio (CAR), Return on assets (ROA), CASA ratio, Credit to deposit ratio (CD ratio), Cost to Income Ratio, Loan-to-Deposit Ratio, Tier 1 and Tier 2 Capital, Asset-Liability Management (ALM), Gross NPA Ratio, Liquidity Ratio, Cost of Funds, Priority Sector Lending, Treasury Operations
General things
Investing like Warren Buffett, Why does Starbucks’s pay so little tax, Rule of 72
Theories and Concepts
Interest Rates, That’s all for now
# General terms
Bull market
A bull market is when the stock market is steadily rising over time.
Note: IPOs are more common in bull markets.
Bear market
A bear market is when stock prices consistently drop, usually by 20% or more, due to negative investor sentiment.
Face value
The face value of a share is its value at the time it’s issued.
- It usually doesn’t change over time.
- In the past, face values were often ₹100, but nowadays, ₹1 or ₹10 is common.
- Splits lower the face value to make shares more affordable for investors.
Example: Companies like MRF avoid splits to reduce volatility.
Growth and Value Stocks
- Growth Stocks: High Price-to-Earnings (P/E) ratios, indicating strong future growth potential.
- Value Stocks: Low P/E ratios, often undervalued relative to their fundamentals.
Dividend
A dividend is a company’s payment to shareholders from its profits.
Key Points:
- It’s not mandatory for a company to pay dividends.
- Dividends are often calculated based on the face value of shares.
Example: If the face value is ₹1 and the dividend is 400%, the dividend per share is ₹4.
Convertible securities
These are investments that can be converted into another type of security, such as preferred stock converting into common stock. They usually offer lower payouts compared to non-convertible securities.
Debenture
A debenture is a loan instrument without collateral.
Key Points:
- Debenture holders earn fixed interest.
- Companies use debentures to raise funds without giving up equity.
Market Capitalization
The total value of a company’s shares in the market.
Market Cap = Number of Shares × Share Price

Full Market Capitalization = (Shares Outstanding x Current Share Price) + Current Long-term Debt
Examples:
- Large-cap: Above ₹20,000 crore
- Mid-cap: ₹5,000–20,000 crore
- Small-cap: Below ₹5,000 crore, often early-stage companies with high risks and potential rewards.
Market depth
Reflects the liquidity of a stock:
- Bid: The highest price a buyer is willing to pay.
- Ask: The lowest price a seller is willing to accept.
Compound Annual Growth Rate
CAGR shows the average yearly growth of an investment.
CAGR = [(Ending Value / Starting Value) ^ (1/Years)] - 1
Example:
If you invest ₹75,000 and it grows to ₹1,00,000 in 5 years:
CAGR = [(1,00,000 / 75,000) ^ (1/5)] - 1 = 5.86%
As you can see, Bill made an average of 5.86% on his investment in new automated equipment. This means that if we could smooth out the earnings and make them equal over the five span, Bill would have made 5.86% every single year. Like I said before, we are trying to simplify the example, so we aren’t considering the effects of labor savings on the return.
Leverage
Leverage means borrowing money to invest, aiming for higher returns. While it can amplify gains, it also increases potential losses.
Share buybacks
When a company buys back its shares to:
- Boost the stock price.
- Improve financial metrics like Earnings Per Share (EPS).
- Regain ownership control.
Book value
The net worth of a company, calculated as:
Book Value = Total Assets - Total Liabilities
Book value per share is the mostly common used metric by investor to see if a company is overpriced or undervalued. But, it cannot be used in isolation. Value investors extensively rely on the book value of an organization and its associated metrics like BVPS and P/B ratio. A P/B ratio below 1 often indicates that a company’s stocks are undervalued since its market capitalization is lower than its book value. Similarly, a high P/B ratio might imply that a company’s stocks are overvalued.
BVPS = Shareholder's equity or Net value of assets / total number of outstanding shares

Price to Bookvalue = Price / Bookvalue
Note : Price to book ratio is useful in asset intensive sectors(utilities)
Accounts Receivable
Money owed to a company by customers for goods or services delivered but not yet paid for.
Accounts Payable
Money a company owes to vendors or suppliers for goods or services received.
Pledging of shares
Using shares as collateral for loans.
Key Risks:
- If loans aren’t repaid, lenders may sell the shares, causing the stock price to drop.
Diversification
Spreading investments across different assets to reduce risks.
Working Capital
A measure of a company’s short-term financial health. If a company’s current assets do not exceed its current liabilities, then it may have trouble growing or paying back creditors, or even go bankrupt.
Working Capital = Current Assets - Current Liabilities
- Working capital ratio = Current Assets/Current Liabilities
- indicates whether a company has enough short term assets to cover its short term debt. Anything below 1 indicates negative W/C (working capital). While anything over 2 means that the company is not investing excess assets. Most believe that a ratio between 1.2 and 2.0 is sufficient. Also known as “net working capital”.
Yield/Dividend Yield
The annual dividend as a percentage of the stock price:
Dividend yield ratio = Dividend per share / Share price
When thinking of dividend stocks, check
- How consistently are they paying dividend
- Do they have room to increase dividend
Buffett Indicator
The Buffett Indicator is the ratio of a specific countries total stock market valuation to GDP.
Buffett Indicator = Total Market Value / GDP
For USA as of September 16, 2021
Aggregate US Market Value = $54.9T
Annualized GDP            = $22.9T
------------------------------------------
Buffett Indicator: $54.9T ÷ $22.9T = 239%
------------------------------------------
It suggests Market is highly overvalued.
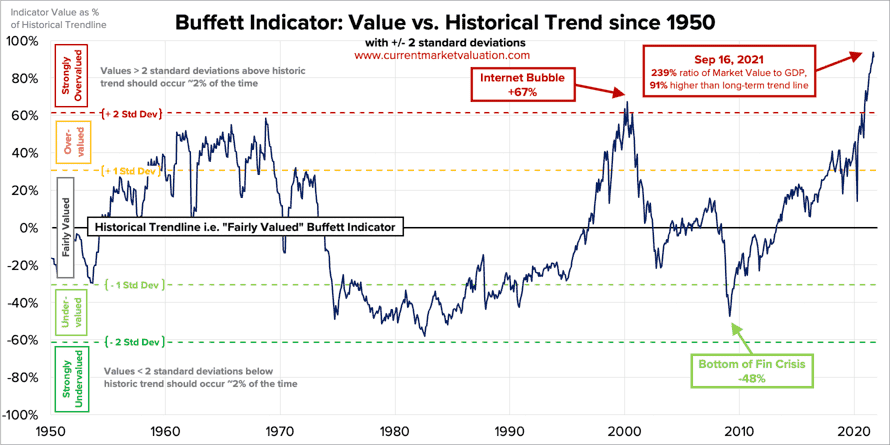
One of the primary criticism about Buffett Indicator is, it does not address the state of non-equity asset markets. In truth, investors have many different asset classes to consider and evaluate when considering portfolio distribution - e.g., corporate bonds, real estate, and commodities.
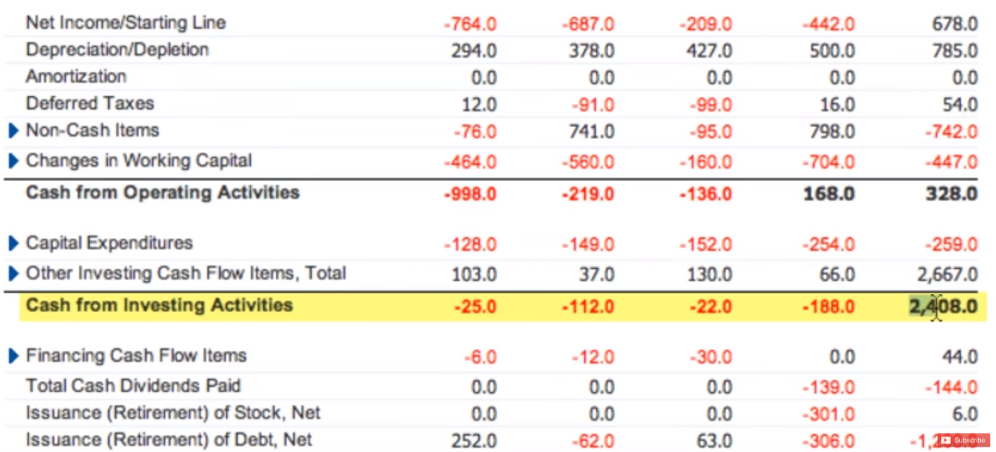
Cash flow
Cash flow is divided into:
- Operating Activities: Day-to-day business operations.
- Investing Activities: Buying or selling assets.
- Financing Activities: Borrowing money or repaying debts.
Good Cash Flow Indicators:
- Positive Operating Cash Flow.
- Negative Investing Cash Flow (shows reinvestment).
- Negative Financing Cash Flow (shows debt repayment).
Note : Operating Activity is the only section of the CF statement that has longevity
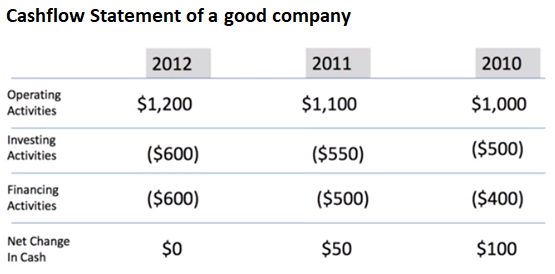
- Operating Activity should grow YoY, this shows the money business in making.
- Investing Activity should be in negative, you can think of as company has taken money from operating activity and investing in a product/plant or purchasing a plant or buying another business. You can also see, business is investing more as they increase more income in the operating activity.
- Financing Activity should be in negative meaning they are paying off their debt.
If the company is planning on acquisition, you can see the increase in the Net Change in Cash
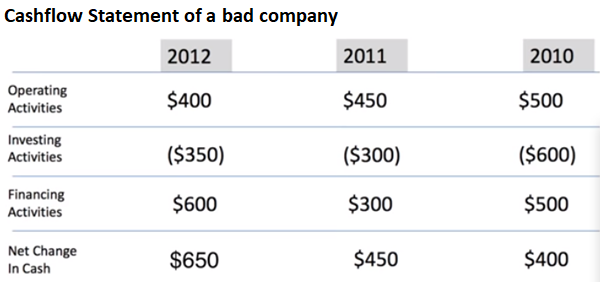
- Operating activity is slowly decreasing, that’s bad.
- Investing activity is also slowly decreasing as operating activity is going down. This is because they dont have enough funds to invest.
- Financing Activyt, they are positive number meaning they are takig more and more debt. Its the money, they are putting in the bank account by borrowing from somewhere. It could be issuing more shares, more bonds, taking out loans.
Below is a good example - WalMart
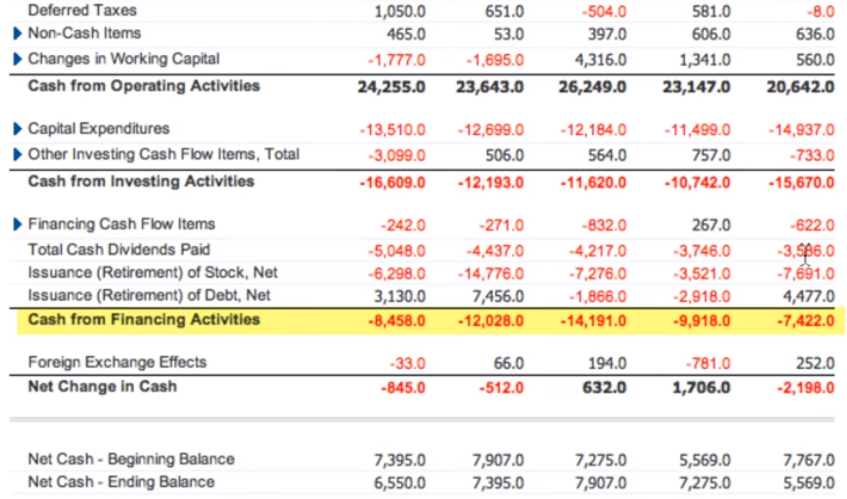
- In Financing Cash Flow Items,
- Issuance(Retirement) of Stock, Net = Share Buyback (thats good)
- Net Cash - Ending Balance, Wal-Marts been having around $7 Billion, always in cash it could be for Emergency, Rainy day funds.
Below is a bad example - Eastman Kodak
- Cash from Investing activity is positive as they sold lots of assets and due to which next year net income became negative thats a clear sign its doing bad.
Ways to cook cash flow - all this is to show statement good for short term,
- Selling big assets after half yearly to boost cash
- Delay paying the creditors
- Look for companies who stopped buying assets and started Renting/Leasing it saves in short term.
- Sale and lease back. Sell the building you are owning to a specific person and lease back.
- Cashflow Operating is the important section in CF statement, so people try to boost that. Buying irrelevant cash generating business. Moving items from CF Investing to Operating.
Also know,
Free Cash Flow Yield = Free Cash Flow / Market Capitalization
Depreciation
Spreading the cost of an asset over its useful life.
An Example of Depreciation Expense Sherry’s Cotton Candy Company earns 7,500 cotton candy machine that it expected to last for five years. If an investor examined the financial statements, he or she might be discouraged to see that the business only made 10,00 profit - $7,000 expense for purchasing the new machinery). The investor would wonder why the profits had fallen so much during the year.
Fortunately, Sherry’s accountants come to her rescue and tell her that the 7,500 / 5 years = 1,500 each year for the next five years, reporting earnings of $8,500. This allows investors to get a more accurate picture of the company’s earning power.
Preferential shares
Shares with fixed dividends and higher repayment priority than regular shares. They behave like bonds but lack voting rights. Warren Buffett likes this and its mostly for long term like > 10 yrs.
- They behave like bond but technically a share.
- Prefs get Fixed dividend. For Normal shares, dividends may differ YoY.
- Prefs get payed first than normal shareholders and dividend amount is higher than ordinary shareholders.
- If company goes bust, prefs will be payed first than ordinary shareholders.
- No voting rights
- No fixed redemption date which a bond has
Before buying prefs check,
- Does company has debt, if they have high debt, how can they pay dividends
- Check in docs, if they had mentioned cumulative dividends, a company can get away without paying dividend for a year but they may pay cumulatively next year.
- Are the prefs callable, a company may callback prefs in 5yrs and reduce the dividend rate and reissue.
Check Bid/Offer spread as it may be illiquid, if so might be a problem when selling.
Banking on Provisions
Banks can improve profits by reversing earlier provisions made for bad loans when those loans are repaid.
10 Red flags
- Balance sheet - huge Good will ( business that has good will twice share holders equity)
- Current ratio ⇐0.5
- Gearing ( total debt three time shareholders equity )
- Plunging Cashflow( cash flow not keeping phase with profits)
- Off balance sheet ( Reading all the notes section is important )
- Adjusted EBITDA ( people making you focus on ebitda rather than other indicators)
- Key management changes ( CEO, CFO resigning, have to wonder why ? )
- Insiders dump shares ( after ipo or before an event )
- Flawed business model ( very few customers )
- Rapid expansion ( like 30% expansion in 3 years )
Undervalued / Under Priced
Stock could be undervalued when,
- Check market capitalization and assets of company
- CMP less than book value is termed stock is cheap triggers a buy signal
- PE < Sector PE
Standalone Vs. Consolidated
- Standalone financial statements are the financial statements of one company, without considering the financial statements of its subsidiary companies.
- Consolidated financial statements are the combined financial statements of the holding company with all its subsidiary companies.
# Liquidity Ratios
Liquidity ratios are financial ratios that measure a company’s ability to repay both short- and long-term obligations. Common liquidity ratios include the following:
Current ratio
The Current Ratio measures a company’s ability to meet its short-term liabilities with its short-term assets.
Current ratio = Current assets / Current liabilities
Data Source : Balance Sheet
Understanding:
- Higher is better: Indicates strong liquidity and financial health.
- Ideal Range: Between 1.5 and 3. Below 1 suggests potential liquidity issues, and above 3 might indicate underutilized assets.
Quick Ratio
The Quick Ratio, also known as the Acid-test or Liquidity ratio, measures the ability of a business to pay its short-term liabilities by having assets that are readily convertible into cash. These assets are, namely, cash, marketable securities, and accounts receivable.
Quick Ratio = [Cash & equivalents + marketable securities + accounts receivable] / Current liabilities
(or)
Quick Ratio = [Current Assets – Inventory – Prepaid expenses] / Current Liabilities
Data Source: Balance Sheet
Understanding:
- Higher is better: Suggests sufficient liquid assets to cover liabilities.
- 1 is considered to be the normal quick ratio. It indicates that the company is fully equipped with exactly enough assets to be instantly liquidated to pay off its current liabilities.
- A company that has a quick ratio of less than 1 may not be able to fully pay off its current liabilities in the short term
- A company having a quick ratio higher than 1 can instantly get rid of its current liabilities. For instance, a quick ratio of 1.5 indicates that a company has 1 of its current liabilities.
Days Sales Outstanding (DSO)
Days Sales Outstanding (DSO) measures the average number of days it takes for a company to collect payment after a sale. It reflects the company’s efficiency in managing its receivables.
DSO = (Accounts Receivable / Total Credit Sales) × Number of Days
Data Source:
- Accounts Receivable: Balance Sheet
- Total Credit Sales: Income Statement or Sales Reports
Understanding:
- Lower is better: Indicates faster collection of receivables, which improves cash flow.
- Ideal Value:
- Industry-dependent; typically, a DSO below 30 days is favorable for most industries.
- A DSO above 45 days might indicate inefficiency in collections.
# Leverage Ratios
Leverage ratios measure the amount of capital that comes from debt. In other words, leverage financial ratios are used to evaluate a company’s debt levels. Common leverage ratios include the following:
Debt Ratio
The Debt Ratio calculates the percentage of a company’s assets financed through debt.
Debt ratio = Total liabilities / Total assets
Data Source: Balance Sheet
Understanding:
- Lower is better: Indicates a stronger financial structure.
- Ideal Value: Below 50% is generally desirable.
Debt-to-equity (D/E) Ratio
This ratio tells how much outside funding is used by the company to run its operations as against its funds.
Debt to equity ratio = Total liabilities / Shareholder's equity
Data Source: Balance Sheet
Understanding:
- Lower is better: Indicates a lower reliance on debt financing.
- Ideal Range: Below 1 is typically preferred.
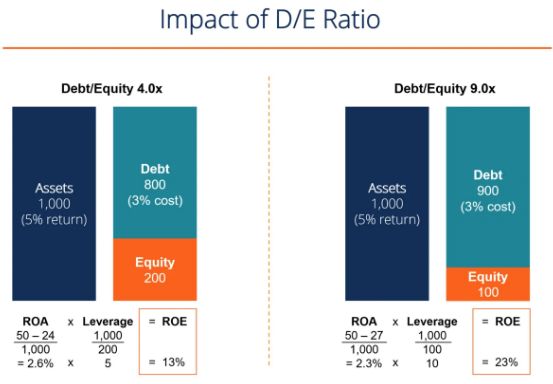 Where:
- Equity = Return on Assets * Leverage
- Return on Assets = Net Income / Total Assets
- Leverage = Total Assets / Equity
Interest Coverage Ratio (ICR)
The Interest Coverage Ratio evaluates a company’s ability to pay interest expenses on its debt.
ICR = EBIT / Interest expense
Where:
- EBIT is the company’s operating profit (Earnings Before Interest and Taxes)
- Interest expense represents the interest payable on any borrowings such as bonds, loans, lines of credit, etc.
Another variation is:
ICR = EBITDA / Interest Expense
Where:
- Earnings before interest, taxes, depreciation and amortization (EBITDA) as the numerator
Data Source: Income Statement
Understanding:
- Higher is better: Demonstrates stronger debt-servicing ability.
- Ideal Value: Above 2. Values below 1 indicate difficulty in covering interest expenses.
Debt-to-Total Assets Ratio
The Debt-to-Total Assets Ratio measures the proportion of a company’s total assets financed by debt. It evaluates the financial leverage of a company. Analysts can compare one company’s leverage with that of other companies in the same industry
Debt-to-Total Assets Ratio = Total Debt / Total Assets
Data Source:
- Total Debt: Balance Sheet (sum of current and non-current liabilities)
- Total Assets: Balance Sheet
Understanding:
- Lower is better: Suggests less reliance on debt financing and stronger financial stability.
- Ideal Value:
- Typically below 50% is considered healthy.
- Values above 70% may indicate a high level of financial risk.
# Efficiency Ratios
Efficiency ratios, also known as activity financial ratios, are used to measure how well a company is utilizing its assets and resources. Common efficiency ratios include:
Asset turnover ratio(ATR)
The Asset Turnover Ratio measures how efficiently a company uses its assets to generate sales. For instance, a ratio of .5 means that each dollar of assets generates 50 cents of sales. Lower ratios mean that the company isn’t using its assets efficiently and most likely have management or production problems.
Asset turnover ratio = Net sales / Average total assets
Data Source: Income Statement & Balance Sheet
Understanding:
- Higher is better: Reflects efficient use of assets.
- Ideal Value: Industry-dependent; higher ratios are favorable.
Inventory turnover ratio
This ratio indicates how many times a company sells and replaces its inventory over a specific period.
A high inventory turnover generally means that goods are sold faster and a low turnover rate indicates weak sales and excess inventories, which may be challenging for a business.
Inventory Turnover Ratio = (Cost of Goods Sold)/(Average Inventory)
Where:
- Average inventory is usually calculated by adding the beginning and ending inventory and dividing by two. The cost of goods sold is reported on the income statement.
Data Source: Income Statement & Balance Sheet
Understanding:
- Higher is better: Suggests efficient inventory management.
- Ideal Value: Greater than 1 is desirable.
If 1 company sells what they make in that year that year itself. So > 1 is very good
Example, For fiscal year 2019, Walmart Stores (WMT) reported annual sales of 44.3 billion, beginning inventory of 385.3 billion.
Walmart’s inventory turnover for the year equaled. 44.3 billion + $43.8 billion)/2 = 8.75
Days Sales in Inventory (DSI)
DSI measures the average number of days it takes for a company to convert its inventory into sales. In addition, goods that are considered a “work in progress” (WIP) are included in the inventory for calculation purposes.
DSI  = 365 days / Inventory turnover ratio
(or)
DSI  = (Average Inventory / Cost of Sales) x 365
Data Source: Income Statement & Balance Sheet
Understanding:
- Lower is better: Indicates faster inventory turnover.
- Ideal Value: Industry-dependent; typically 30-90 days for most businesses.
A low DSI reflects fast sales of inventory stocks and thus would minimize handling costs, as well as increase cash flow. On the other hand, a high DSI value generally indicates either a slow sales performance or an excess of purchased inventory (the company is buying too much inventory), which may eventually become obsolete. However, it may also mean that a company with a high DSI is keeping high inventory levels to meet high customer demand. It is also important to note that the average days sales in inventory differs from one industry to another.
Example, For fiscal year 2019, Walmart Stores (WMT) reported annual sales of 44.3 billion, beginning inventory of 385.3 billion.
Its days inventory equals: (1 ÷ 8.75) x 365 = 42 days
This indicates that Walmart sells its entire inventory within a 42-day period, which is impressive for such a large, global retailer.
# Profitability Ratios
Profitability ratios measure a company’s ability to generate income relative to revenue, balance sheet assets, operating costs, and equity. Common profitability financial ratios include the following:
Gross margin ratio
The Gross Margin Ratio shows the percentage of revenue retained as gross profit after covering the cost of goods sold (COGS).
For example, if the ratio is calculated to be 20%, that means for every dollar of revenue generated, 0.80 is attributed to the cost of goods sold. The remaining amount can be used to pay off general and administrative expenses, interest expenses, debts, rent, overhead, etc.
Gross Margin Ratio = (Revenue – COGS) / Revenue
(or)
Gross margin ratio = Gross profit / Net sales
Data Source: Income Statement
Understanding:
- Higher is better: Reflects profitability and efficiency.
- Ideal Range: Above 40% is considered strong for most industries.
Operating margin ratio
The Operating Margin Ratio measures the percentage of revenue remaining after covering operating expenses. Its also known as OPEX. The operating ratio shows how efficient a company’s management is at keeping costs low while generating revenue or sales.
Operating margin ratio = (Operating expenses + CoGS) / Net sales
(or)
Operating margin ratio = Operating Profit / Total Revenue
Where:
- Operating Profit = Sales - COGS - Operating Expenses - Depreciation & Amortization
Data Source: Income Statement
Understanding:
- Higher is better: Demonstrates operational efficiency.
- Ideal Range: Varies by industry; 15-20% is strong for most sectors.
Return on equity ratio
ROE measures how effectively a company generates profit from its shareholders’ equity. Also known as Return on Net Worth(RoNW)
Return on equity ratio = Net income / Shareholder's equity
(or)
Return on Net Worth = Net after-tax profits ÷ (Shareholder capital + Reserves)
(or)
Return on Equity Ratio = (Net Earning after taxes - Preferred Dividends)/Common Equity Dollars
Data Source: Income Statement & Balance Sheet
Understanding:
- Higher is better: Indicates efficient use of equity to generate returns.
- Ideal Value: Above 15% is generally considered good.
Return on Assets (ROA)
Return on Assets (ROA) measures how efficiently a company uses its assets to generate net income. It indicates the profitability of a company relative to its total assets.
Return on Assets (ROA) = Net Income / Average Total Assets
Data Source:
- Net Income: Found in the Income Statement (Annual or Quarterly Results).
- Average Total Assets: Calculated as the average of beginning and ending total assets from the Balance Sheet.
Understanding:
- Higher is better: Indicates efficient utilization of assets to generate profit.
- Ideal Value:
- Industry-specific: ROA is typically higher in asset-light industries (e.g., technology) and lower in asset-heavy industries (e.g., manufacturing).
- A ROA above 5% is generally considered good, and above 10% is excellent.
# Valuation Ratios
Earnings per share (EPS) Ratio
Earnings Per Share (EPS) measures the amount of net income earned for each outstanding share of a company’s stock. It is a key indicator of a company’s profitability.
Earnings per share ratio = Net earnings / Total shares outstanding
Data Source:
- Net Earnings: Income Statement (Annual/Quarterly Results).
- Total Shares Outstanding: Financial Statements or Market Data.
Understanding:
- Higher is better: A higher EPS indicates better profitability and value per share.
- Ideal Value:
- No fixed threshold; it varies by industry. However, an increasing EPS trend over time is favorable.
Price-to-Earnings (P/E) Ratio
The Price-to-Earnings (P/E) Ratio compares a company’s stock price to its earnings per share, reflecting market expectations of future growth.
P/E = Current Market Price / Earnings Per Share
(or)
P/E = Market Capitalization / Total Net Earnings
Data Source:
- Current Market Price: Market Data.
- EPS or Net Earnings: Income Statement (Annual/Quarterly Results).
Understanding:
- High P/E: Indicates growth expectations; may mean overvaluation if not supported by fundamentals. Also if, investors are expecting high growth rate in the future.
- Low P/E: Suggests undervaluation or slower growth expectations.
- Ideal Value:
- Industry-specific; a P/E ratio below the sector average often signals a value stock, while high-growth sectors typically have higher P/Es.
Price/Earnings to Growth (PEG) Ratio
The PEG ratio is a company’s Price/Earnings ratio divided by its earnings growth rate over a period of time (typically the next 1-3 years). The PEG ratio adjusts the traditional P/E ratio by taking into account the growth rate in earnings per share that are expected in the future.
PEG = (P/E) / Earnings per Share growth rate
Data Source:
- P/E: Calculated using EPS and Market Price.
- Earnings Growth Rate: Company Projections or Analyst Reports.
Understanding:
- PEG < 1: Stock may be undervalued.
- PEG = 1: Stock is fairly valued.
- PEG > 1: Stock may be overvalued.
For example, a stock with a P/E of 20 and projected earning growth next year of 10% would have a PEG of 20 / 10 = 2.
- If PEG ratio=1, it means that the share at today’s prices is fairly valued.
- If PEG ratio>1, it indicates that the share is possibly over-valued.
- If PEG ratio<1, it indicates that the share is possibly under-valued.
Price-to-Sales(P/S) Ratio
The Price-to-Sales (P/S) Ratio measures how much investors are willing to pay per dollar of sales, offering insights into valuation relative to revenue. Like all ratios, the P/S ratio is most relevant when used to compare companies in the same sector.
PSR = Market Capitalization / Total Revenue
(or)
PSR = Share Price / Total Sales
Data Source:
- Market Capitalization: Market Data.
- Total Revenue: Income Statement (Annual/Quarterly Results).
Understanding:
- Lower is better: Indicates undervaluation or efficient revenue generation.
- Ideal Value:
- A P/S ratio below 1 is generally favorable.
Some investors are even more conservative and add the current long-term debt of the company to the total current market value of its stock to get the market capitalization. The logic here is that if you were to acquire the company, you would acquire its debt as well, effectively paying that much more. This avoids comparing PSRs between two companies when one has taken out enormous debt to use to boost sales, and the other has lower sales but no additional nasty debt.
EV/EBIT Ratio
The EV/EBIT Ratio compares a company’s enterprise value (EV) to its earnings before interest and taxes (EBIT), reflecting operational profitability relative to total valuation.
EV/EBIT = Enterprise Value / EBIT

Enterprise Value = Equity Market Capitalization + Total Debt − Cash (& Cash Equivalents)
Data Source:
- EV: Derived from Market Capitalization, Debt, and Cash (Balance Sheet & Market Data).
- EBIT: Income Statement (Annual/Quarterly Results).
Understanding:
- Lower is better: Indicates financial stability and operational efficiency.
- Ideal Value:
- EV/EBIT values vary across industries. A ratio below the industry average is generally considered favorable.
# Financial Ratios
Return on Capital Employed(RoCE)
It measures how efficiently a company is using its capital to generate profits. It indicates efficiency/profitability of a company’s capital investments. It should be higher than the rate at which the company borrows. If it is not the case, increase in borrowing will reduce shareholder earnings.
RoCE does not account for depreciation and amortisation of capital. Because capital employed is the denominator, a company with higher depreciated assets may report a higher RoCE without an increase in profit. Also, RoCE is low for companies that are capital intensive. For companies with insignificant debt, RoE and RoCE are the same. RoCE has little impact on stock prices by the time it is known.
Return on Capital Employed(debt free companies) = EBT/Equity
(or)
Return on Capital Employed = Net Profit Afer Tax / ( Total Assets - Current Liabilities )
Data Source: Income Statement & Balance Sheet
Understanding:
- Higher is better: Indicates better utilization of capital.
- Ideal Value: Above the cost of capital; typically 15% or higher is favorable.
Return on Invested Capital
ROIC is generally based on the same concept as ROCE, but its components are slightly different.
RoIC = Net operating profit after tax / invested capital
Where:
- Net operating profit after tax: This is a measure of EBIT x (1 – tax rate). This takes into consideration a company’s tax obligations, but ROCE usually does not.
- Invested capital in the ROIC calculation is slightly more complex than the simple calculation for capital employed used in ROCE. Invested capital may be either:
- Net working capital + property plant and equipment + goodwill and intangibles
- Total debt and leases + total equity and equity equivalents + non-operating cash and investments
Cash Profit Margin
Some analysts use “earnings before interest, tax, depreciation and amortisation” (EBITDA) to sales ratio, called cash profit margin, to measure operating performance. They prefer to use EBITDA margin because they believe that it focuses on cash operating items.
However, this assumption is not correct and is misleading because sales, cost of sales, and other operating expenses (other than depreciation and amortisation) often include non-cash items. Moreover, depreciation is a real operating expense, and it, to some extent, reflects consumption of resources. Therefore, cash profit margin is misleading and fails to measure the operating performance appropriately.
Some companies use “free cash flow” as a metric to measure operating performance. Free cash flow is calculated by adding depreciation to operating profit and deducting increase in investment in fixed assets and working capital. Free cash flows form the basis for estimating the intrinsic value of the company. A company that focuses on the intrinsic value of the company does not focus on the free cash flow from year to year.
A company may have low or negative cash flows in the initial years due to heavy investments that are expected to generate high free cash flow in subsequent years. Those companies use ‘value’ as the measurement metric. They compare intrinsic value at the end and at the beginning of the year.
# Banking Ratios
Net Interest Margin (NIM)
The difference between interest earned and interest expended, expressed as a percentage of interest-earning assets. It reflects the profitability of a bank’s core lending and borrowing activities.
Net Interest Margin = (Interest Income – Interest Expense) / Total Assets
Non-Performing Assets (NPA)
The net NPA to loans (advances) ratio is used as a measure of the overall quality of the bank’s loan book. An NPA are those assets for which interest is overdue for more than 90 days (or 3 months).
The net NPA is that portion of bad loans which has not been provided for in the books. Higher ratio reflects rising bad quality of loans.
NPA ratio = Net non-performing assets / Loans given
Provisioning
The amount set aside by a bank to cover potential loan losses. Higher provisioning may impact the bank’s profitability but is crucial for managing risks associated with NPAs. A high PCR ratio (ideally above 70%) means most asset quality issues have been taken care of and the bank is not vulnerable.
Provision coverage ratio = Cumulative provisions / Gross NPAs
Capital Adequacy Ratio (CAR)
A bank’s capital ratio is the ratio of qualifying capital to risk adjusted (or weighted) assets. The RBI has set the minimum capital adequacy ratio at 9% for all banks. A ratio below the minimum indicates that the bank is not adequately capitalized to expand its operations. The ratio ensures that the bank do not expand their business without having adequate capital.
CAR = Tier I capital + Tier II capital / Risk weighted assets
It must be noted that it would be difficult for an investor to calculate this ratio as banks do not disclose the details required for calculating the denominator (risk weighted average) of this ratio in detail. As such, banks provide their CAR from time to time.
Tier I Capital funds include paid-up equity capital, statutory and capital reserves, and perpetual debt instruments eligible for inclusion in Tier I capital. Tier II capital is the secondary bank capital which includes items such as undisclosed reserves, general loss reserves, subordinated term debt, amongst others.
Return on assets (ROA)
Return on Assets (ROA) is a type of return on investment (ROI) metric that measures the profitability of a business in relation to its total assets. This ratio indicates how well a company is performing by comparing the profit (net income) it’s generating to the capital it’s invested in assets. The higher the return, the more productive and efficient management is in utilizing economic resources.
Returns on asset ratio is the net income (profits) generated by the bank on its total assets (including fixed assets). The higher the proportion of average earnings assets, the better would be the resulting returns on total assets. A lower RoA means that bank is not able to utilise assets efficiently. Negative RoA implies assets are yielding negative return.
ROA = Net profits / Avg. total assets
Example, If a business posts a net income of 50 million worth of assets as per the balance sheet, what is its return on assets. 50 million is 0.2, therefore the business’s ROA is 20%. For every dollar of assets the company invests in, it returns 20 cents in net profit per year.
CASA ratio
The ratio of Current and Savings Accounts (CASA) deposits to total deposits.
- A higher CASA ratio is generally considered positive as it reduces the cost of funds for the bank.
- A low CASA ratio means the bank relies heavily on costlier wholesale funding, which can hurt its margins
Credit to deposit ratio (CD ratio)
The ratio of loans disbursed by a bank to its total deposits. It indicates how much of the deposits are being utilized for lending activities.
Cost to Income Ratio
The ratio of operating expenses to operating income. A lower ratio indicates better cost management.
Loan-to-Deposit Ratio
The ratio of a bank’s total loans to its total deposits. It reflects the bank’s reliance on deposits for lending activities.
Tier 1 and Tier 2 Capital
Tier 1 capital includes common equity and retained earnings, while Tier 2 capital includes subordinated debt and other less secure forms of financing. These are components of the capital adequacy ratio.
Asset-Liability Management (ALM)
A risk management strategy that aims to balance a bank’s assets and liabilities to ensure stability and minimize interest rate risk.
Gross NPA Ratio
The ratio of total gross NPAs to total advances. It gives an overall picture of the asset quality of a bank.
Liquidity Ratio
The ratio of a bank’s liquid assets (cash and equivalents) to its total liabilities. It measures the ability of a bank to meet short-term obligations.
Cost of Funds
The interest rate a bank pays to acquire funds. It includes interest paid on deposits and other borrowings.
Priority Sector Lending
Mandated lending by banks to specific sectors identified by the RBI, such as agriculture, small enterprises, and education. It aims to promote inclusive growth.
Treasury Operations
The management of a bank’s investments in financial instruments, including government securities, bonds, and money market instruments.
# General things
Investing like Warren Buffett
- High ROCE + Low Debt
- Predictable Earnings
- Profits = Cash flow
- Uncomplicated business
- Strong Brand + Pricing Power
- Management should be owners of business
Why does Starbucks’s pay so little tax
Falsifying sales can be easily found, so nobody does that. So people will be work on increasing operational cost.
- Intercompany taxing.
- UK StarBucks borrows from US HQ and pay lots of interest which reduces the net profit in UK, so little tax
- Royalty Agreement
- This is made with Starbucks company in less tax paying country like Holland. Agreement will be like 6% of Sales will be payed as Royalty to Starbucks Holland.
- Past losses
- Losses can be carried forward for tax purposes. Marketing and Setup costs
This percentage of interest, royalty will be certain amount that can be negotiable with Tax people of the country.
Rule of 72
If you ever wanted to know, when your investment will double. If a person says, this investment gives 7% return annually. Then your calculation should be like
72/7 = 10
So it will take 10yrs to double
# Theories and Concepts
Interest Rates
The 50,000ft overview on interest rates is as follows. When interest rates are high, bonds pay a high return to investors, which lowers demand (and prices) of the riskier equities. Additionally, higher interest rates means it’s more expensive for businesses to borrow money, making it harder to borrow cash as a way to finance growth. Which is to say any business that takes on debt will face relatively higher interest payments, and therefore less profits. And again, less profits means lower stock prices. The corollary to all this is also true. Low interest rates means bonds pay less to investors, which lowers demand for them, which raises stock prices in relation to bonds. Low interest rates make it easy for corporations to borrow cash cheaply to finance growth. Corporate interest payments will be low, making profits high. This is all to say, if interest rates are high, stocks go down. If interest rates are low, stocks go up.
There are two core reasons that stock markets and interest rates tend to move inversely with one another.
-
Lower Profits. As market interest rates rise, that means that firms who wish to borrow money in order to fund profitable projects will need to pay more in interest payments. This will necessarily lower profits. In some cases, it means the firms will not be able to do the project at all. Lower profits mean lower stock prices, since stock prices are fundamentally a measure of all future profits of a firm. The opposite is true as well - as rates fall firms are able to borrow more, which increases profits and expands economic output.
-
Less Demand. As market interest rates rise investors are able to earn higher yields by investing in debt instruments (bonds, etc) rather than equities (stocks). This lowers the demand for stocks, which lowers their prices. Likewise, when interest rates are very low, investors seeking a return on their cash don’t have many available choices, and tend to get pushed into riskier assets (lower quality bonds, stocks), in order to make a return. This drives those prices higher.
US interest rates are currently near all-time lows. Broadly speaking, this means that investments made in low risk products (e.g., bonds) are paying little in returns, and so are not highly demanded by investors.
Below is a composite chart which suggests US stock market is Fairly Valued. The two relative performance indicators for interest rates (red) and stocks (blue) have been combined, showing a composite value in purple.
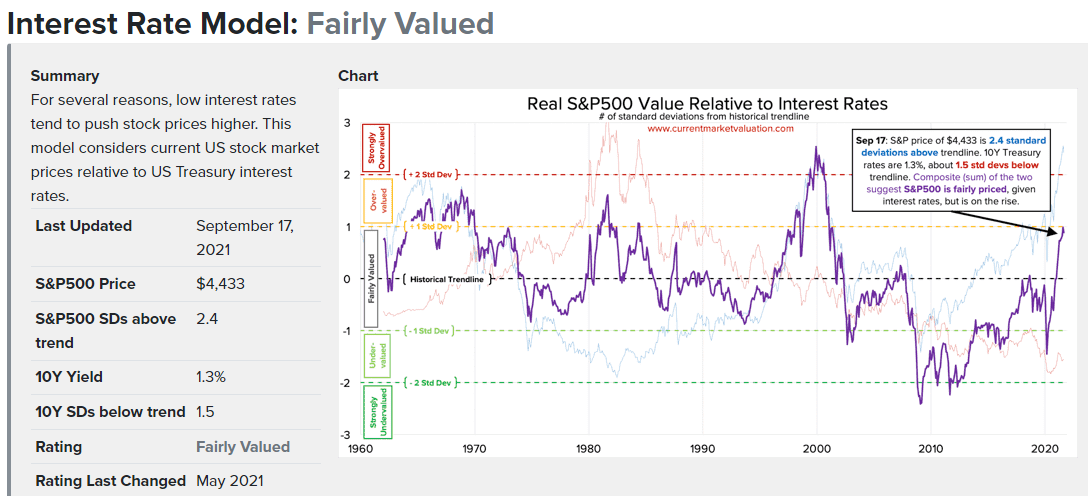
When greater than zero, this indicates that rates are high, and stocks are also high. The peak here is during the 2000 internet bubble. During this time stocks prices were very high, but bond prices were right around average… meaning that even though investors had other good options to invest in, and despite the high interest rates firms needed to pay in order to borrow money, stocks were still very high. That’s a clear bubble - which we all know in retrospect popped loudly and abruptly.
On those merits, we are not in a similar bubble today. As of September 17, 2021, the 10Y Treasury bond rate was 1.3%, which is 1.5 standard deviations below normal. Likewise, the S&P500 value of $4,433 is 2.4 standard deviations above its own respective trendline. Summed together, this gives a composite value of 0.9 standard deviations above normal, indicating that stocks are currently Fairly Valued.
Sources :